Contents
Practical Skills Assessed in a Written Examination
Planning
The first skill to master is being able to plan a valid method.
There are 4 key aspects to consider in any plan:
- Select the most appropriate apparatus.
- Outline the exact techniques of how to use the apparatus.
- Identify the independent, dependent, and control variables.
- Have a suitable control experiment to demonstrate that only the independent variable is causing any change to the results.
In an exam question, if you are asked to ‘evaluate the method,’ then consider the 4 points above and highlight the pros and cons regarding each point in the method provided.
Selecting Appropriate Apparatus
If you needed to measure 5ml of a solution, you may have to decide whether a syringe or measuring cylinder would be more appropriate. A syringe is more appropriate for measuring small volumes, as it is more precise and accurate.
Syringe
Measuring Cylinder
To test that you can use equipment correctly, you may be asked to read off the volume in each of the images above. The syringe volume is 2.9ml in this image (you read off from the top of the black plunger and there must be no air bubbles). However, because the plunger is between 2.8ml and 3.0ml, there is 1 ml uncertainty in this reading. The measuring cylinder contains 3.8ml (you read off from the meniscus and the measuring cylinder must be on a flat surface, not in your hand, so the meniscus stays in the same position).
The dashed line shows where the meniscus is.
Implementing
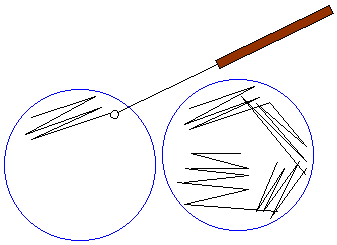
The second skill to master is implementing your plan accurately. For example, within your practical lessons, you need to show that you can follow the techniques you outlined for using equipment. This could be knowing how to measure a precise volume using a syringe or knowing how to create a streak plate pattern to grow individual colonies of bacteria.
Streak Plate
Template of where and how to spread the bacteria on.
The bacteria that has grown in the locations it was streaked.
During any experiment, you should be recording your observations, whether these are quantitative (numerical) or qualitative (descriptions). You will be assessed on whether you record observations properly, such as using appropriate units for quantitative data. All observations recorded must be easy for others to understand for them to be useful, and therefore you will be assessed on how you present your observations. For example, did you create a data table with the independent variable in the left column and the dependent variable in the right, did you label the heading of each column and state units, and did you record all values in the table to the same number of decimal places.
Analysis
For recorded observations to be of any use, they must be analyzed to help reach a valid conclusion.
This can require data to be processed first, which means conducting calculations or statistics to gain more meaning from the data. This could be as simple as calculating a mean, median, or mode, or it could be more complex processing such as working out the standard deviation and/or a statistic. At all stages, ensure you are presenting data to an appropriate number of significant figures, again to make the numerical data easier to understand and compare.
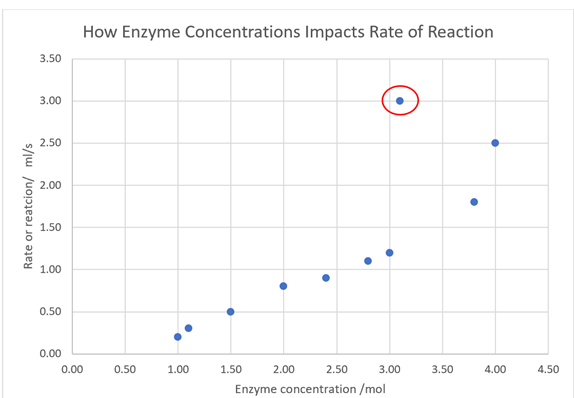
If you have vast amounts of data, it can be hard to spot patterns in a table. For this reason, being able to plot a suitable graph is very useful as a visual helps with interpretation and pattern spotting. For example, the graph and table below both show the same data, but it is much easier and quicker to analyze the data in the graph and to identify that the pattern is a positive correlation, but there is an anomaly at 3.10mol.
| Enzyme concentration / mol | Rate of reaction / ml/s |
| 1.00 | 0.20 |
| 1.10 | 0.30 |
| 1.50 | 0.50 |
| 2.00 | 0.80 |
| 2.40 | 0.90 |
| 2.80 | 1.10 |
| 3.00 | 1.20 |
| 3.10 | 3.00 |
| 3.80 | 1.80 |
| 4.00 | 2.50 |
You could be asked to draw or plot part of a graph in the written exam to test this skill. Aspects you would be marked on are: Did you select the correct data for each axis with an appropriate scale, did you label both axes and include units, and did you draw an accurate line of best fit (straight or curved) if appropriate. This could then link to the Math skills of working out the gradient of a line.
Evaluation
Evaluating data is when you would pick out patterns in the data that do and do not support a suggested conclusion.
Patterns or aspects to consider are:
- Are there any anomalies?
- Are there any limitations in the method that could have resulted in inaccurate data?
- How precise and accurate were the practical techniques used?
- Is there any information given on margins or percentage error/uncertainties?
- Is there standard deviation or a statistic given?
You could also be asked to suggest improvements to methods. The strategy for answering these types of questions is to consider the 4 pointers above, then review the method and look for changes to equipment or techniques that could result in more accurate data. This could include suggesting more repeats, a control experiment, more control variables, calculating a statistic to see if the pattern is significant, an unbiased group to study, or a more appropriate piece of equipment to use.


